
Tare drift: what a reusable bin does to net-weight accuracy

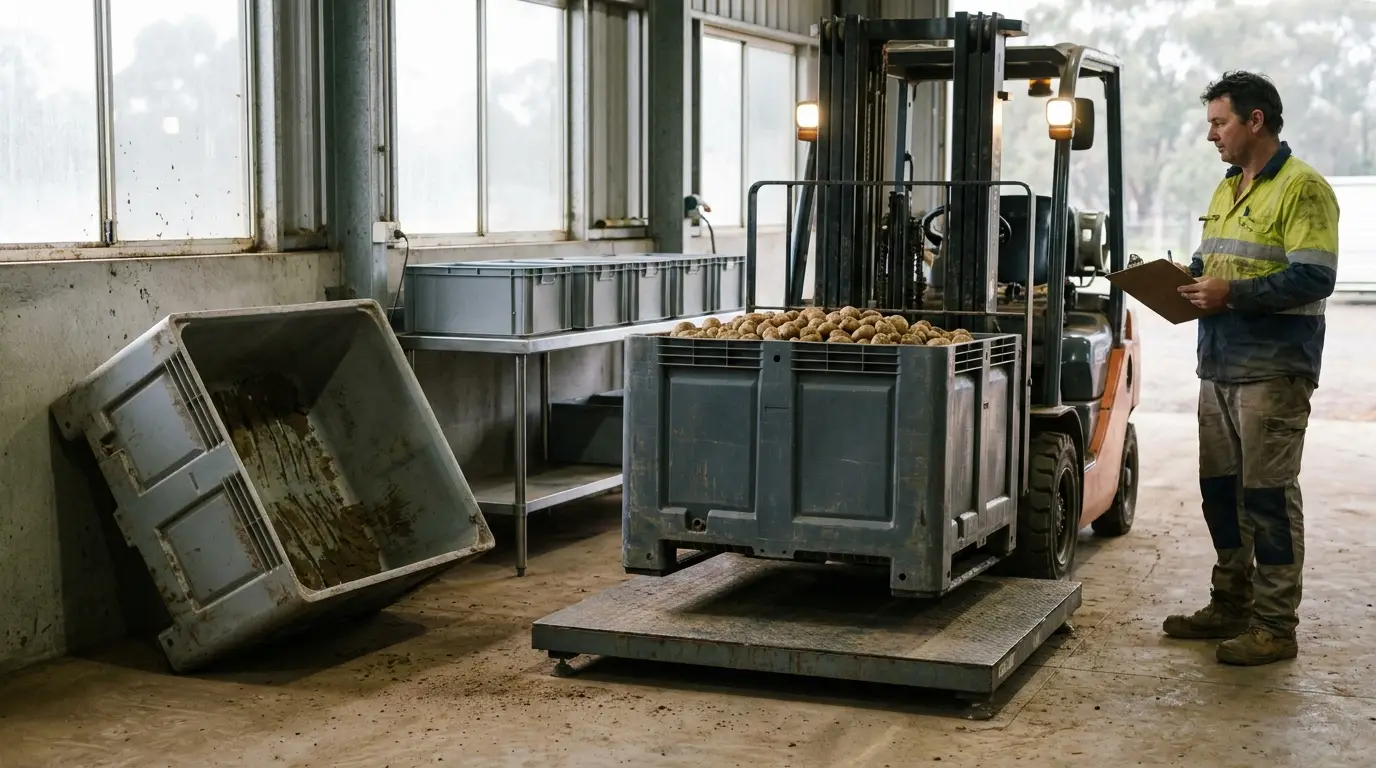
Tare weight is the least glamorous number on a container spec sheet and the only one that appears on an invoice. Every time a loaded bin crosses a scale and the empty mass gets subtracted, that number decides how much product you are recorded as having shipped. It is treated as a fixed property of the model. It is not: it is a nominal figure describing the container on the day it was moulded, applied to a container that has been working for years, and every mechanism that changes it moves it in the same direction.
Does a bin’s tare weight actually matter?
It matters in three quite different ways, and they are usually confused with each other.
It is a freight number, because tare rides on the truck and eats payload — that argument is already worked through in bins per semi-trailer and is not repeated here. It is a manual-handling number, because someone lifts the empty unit — covered in pallet weight and manual handling. And it is an accounting number, because it is subtracted from every gross weight to produce the net figure you invoice against. That third one has no page anywhere on this site, or on most others, and it is the one with a regulator attached to it.
Two things make it worth an article rather than a footnote. First, the spread between models is far larger than anyone assumes and does not follow the rule of thumb everyone uses. Second, the error is not random: it accumulates in one direction, and it accumulates against the seller.
What tare really costs: 4.75% to 13.67% of gross
Take every container in the range that publishes both a tare and a volume — 67 SKUs, 36 bulk containers and 31 crates. Fill each one to its published volume at a stated planning density of 600 kg/m³ (the same figure we use across the site; substitute your own and the ranking barely moves), and ask what fraction of the loaded mass is container.
| Container | External (mm) | Volume | Tare | Payload at 600 kg/m³ | Tare as % of gross | Published static |
|---|---|---|---|---|---|---|
| BPB-V121210-18 | 1200 × 1200 × 1000 | 1,070 L | 32 kg | 642 kg | 4.75% | 1,400 kg |
| BPB-V121010-18 | 1200 × 1000 × 1000 | 850 L | 29.4 kg | 510 kg | 5.45% | 1,200 kg |
| BPB-AP10 (crate) | 645 × 413 × 276 | 52 L | 1.8 kg | 31.2 kg | 5.45% | — |
| BPB-AP4 (crate) | 430 × 323 × 127 | 13 L | 0.62 kg | 7.8 kg | 7.36% | — |
| BPB-1311S | 1300 × 1150 × 1250 | 1,400 L | 71 kg | 840 kg | 7.79% | 7,000 kg |
| BPB-C1212S80 | 1200 × 1200 × 805 | 880 L | 52 kg | 528 kg | 8.97% | 7,000 kg |
| BPB-D1208V44 | 1200 × 800 × 440 | 240 L | 21.5 kg | 144 kg | 12.99% | 4,000 kg |
| BPB-K1165HV | 1162 × 1162 × 560 | 470 L | 44 kg | 282 kg | 13.50% | 2,800 kg |
| BPB-H1111FS | 1100 × 1100 × 1139 | 1,000 L | 95 kg | 600 kg | 13.67% | 7,500 kg |
The full range across all 67 is 4.75% to 13.67% — a 2.88× spread in how much of a loaded container is container. Now look at what the extremes actually are, because this is the finding that overturns the rule of thumb.
Everyone assumes tare efficiency is a size story: big bin good, small crate wasteful. It is not. The best and worst performers in the whole range are both bulk containers, and they are within 7% of each other on volume — 1,070 L at 32 kg against 1,000 L at 95 kg. That is 2.97× the tare for 7% less capacity. Meanwhile the 31 crates span 5.36% to 10.89%, which sits entirely inside the bulk-container range of 4.75% to 13.67%. Follow that through and it is startling: a 13 L crate at 7.36% is more tare-efficient than 33 of our 36 bulk containers. Buying bigger does not, by itself, buy you a smaller tare fraction — it mostly buys you fewer forklift moves.
Why you cannot just buy the lightest bin
The obvious response to that table is to order the 32 kg bin. Here is why that is a decision and not a free win. Hold the footprint constant at 1200 × 1200 and compare like with like:
| 1200 × 1200 bulk container | Tare | Volume | Tare share | Static | Dynamic | Material / class |
|---|---|---|---|---|---|---|
| BPB-V121210-18 | 32 kg | 1,070 L | 4.75% | 1,400 kg | 700 kg | PP, light weight |
| BPB-C1212V80 (vented) | 50.5 kg | 880 L | 8.73% | 7,000 kg | 850 kg | HDPE, heavy duty |
| BPB-C1212S80 (solid) | 52 kg | 880 L | 8.97% | 7,000 kg | 850 kg | HDPE, heavy duty |
The light bin is 1.89× better on tare share. It also publishes a static rating 5.0× lower and a dynamic rating 18% lower. That is the trade in one line: tare efficiency is bought with load capacity, and the ceiling on how far you can optimise tare is set by what the container has to survive in your operation, not by what looks good on an invoice.
There is a second-order point in that table worth noticing. At 600 kg/m³, the light bin’s assumed payload is 642 kg against a published dynamic rating of 700 kg. It fits, but not by much — and dynamic is the figure that governs a loaded lift. The heavy bins carry a smaller volume against a higher rating and sit nowhere near theirs. Tare-efficient containers tend to be tare-efficient partly because they are rated for less, and at a dense crop that margin closes fast.
Tare drift only runs one way
Everything above uses the published tare. A working container does not have the published tare, and the gap has a direction.
The mechanisms are unremarkable: soil and crop residue packed into the ribs and corner gussets and the underside of the base; adhesive and label residue that survives a wash; water trapped in a folding hinge, a base cavity or a doubled wall; components replaced or added after damage; tags, liners and hardware fitted over the years. Every one of those adds mass. There is no mechanism that quietly removes it, short of a wash that gets into the same places the soil got into — which is exactly the argument for a proper cycle in hot-wash and sanitation.
One correction worth making, because it is the intuition people bring across from timber. The polymer itself is not the problem. A sawn timber bin takes up water and gains real, unrecorded mass through the season; a moulded HDPE or PP wall does not behave that way, and we quote no water-absorption figure here because we have not verified one to cite. On a plastic unit, drift is what sticks to it and what gets bolted to it, not what soaks into it. That is good news, because both of those are visible and both are fixable.
The consequence is asymmetric, and this is the part that matters commercially. If the tare you subtract is lighter than the container actually is, the net you calculate is heavier than the goods actually are, and you have invoiced for product you did not ship. Since drift only runs heavier, a fleet-wide nominal tare produces a systematic over-statement of net. It is small per load and structural per season, and it always lands on the same party.
“Nobody argues about tare until an inspector or a customer weighs something. Then it turns out the shed has been subtracting a brochure figure for six years while the bins got heavier. It is never a big number on one load, and that is exactly why it goes unnoticed for six years.”
John Meir, Sales Lead
Where drift actually bites: the small unit
Now the counter-intuitive half. If drift always runs heavier, which units are exposed? The instinct says the big bins, because they collect the most soil. The arithmetic says the opposite, because what matters is drift relative to net.
| Container | Net at 600 kg/m³ | Drift needed to move net by 1% | Effect of 0.1 kg drift | Effect of 1 kg drift |
|---|---|---|---|---|
| BPB-1311S (1,400 L) | 840 kg | 8.40 kg | 0.012% | 0.119% |
| BPB-C1212S80 (880 L) | 528 kg | 5.28 kg | 0.019% | 0.189% |
| BPB-D1208V44 (240 L) | 144 kg | 1.44 kg | 0.069% | 0.694% |
| BPB-AP15 crate (68 L) | 40.8 kg | 0.408 kg | 0.245% | 2.451% |
| BPB-C5638S crate (50 L) | 30.0 kg | 0.300 kg | 0.333% | 3.333% |
| BPB-AP4 crate (13 L) | 7.8 kg | 0.078 kg | 1.282% | 12.821% |
One kilogram of unrecorded build-up is 0.119% of net on the 1,400 L bin and 12.8% on the 13 L crate — a 108× difference in consequence for identical drift. Put it the other way round: it takes 8.4 kg of accumulated soil to move a giant bin’s net by one per cent, and 78 grams to do the same to a small crate. Seventy-eight grams is a smear of dried mud in the base ribs.
Two consequences follow, and they compound. Small units are where drift is proportionally largest and they are handled, washed and weighed far more often per tonne shipped, so they accumulate more opportunities to drift and more chances to carry that drift into a measurement. The unit nobody worries about is the exposed one.
Which leads to the honest statement of the problem. A fleet does not have a tare; it has a distribution of tares, widening every year. Applying one nominal figure to that distribution is applying a mean to a spread, and the error on any individual invoice is set by the spread, not the mean. Averaging does not save you on the load in front of you.
What the trade-measurement rules actually say
We are a container supplier, not a trade-measurement authority, so this section points rather than advises. Sale by measurement in Australia is regulated under the National Measurement Act 1960 and the National Trade Measurement Regulations 2009, administered by the National Measurement Institute. Three published points bear directly on tare.
- Net means net. For pre-packaged produce, NMI states you must “only display the net weight of the fruit or vegetables (do not include the weight of any packaging)”, and that you must allow for moisture loss so the weight is accurate at the time of sale — not at the time of packing.
- The instrument is your responsibility. Scales used for trade must be an NMI-approved type, verified by a servicing licensee, kept clean and in good working order, and verified again after each repair or adjustment. NMI puts it plainly: “It is your responsibility to make sure your scale is correct at all times.”
- The penalty is real. NMI states that if an inspector finds you are short-measuring your customers, you could be fined up to $222,000 per offence (industry.gov.au).
Notice which way that last one points. Short measure is an offence committed by the party doing the selling. Combine it with the direction of drift — always heavier, always over-stating net — and the shape of the risk is clear: the mechanism runs, unattended, in the direction of the one error the regulator sanctions. Which duties apply to your specific arrangement, and what tolerances attach to them, is a question for NMI. Getting the physical tare right is a question for you, and it is entirely solvable.
How to tare a reusable fleet properly
Five steps. None of them is a product.
- Tare by asset, not by catalogue. The published figure is a nominal for a model. What you need is a measured figure for a unit. That means each container needs a durable identifier and a record behind it — which is exactly the permanent asset ID we argue for in bin traceability and lot codes, where the same identifier already carries the lot record. One tag, two jobs.
- Re-weigh on events, not just on dates. After a repair or component change. After a job that put the unit in mud. At the start of a season. A random sample is enough to tell you whether the fleet has moved; a whole-fleet weigh is only needed once the sample says it has.
- Track the spread, not the average. If you must use one figure for invoicing, know how wide the distribution is around it, and set the assumed tare so the error does not run systematically against you. A mean that is 2 kg light on every unit is not a rounding error, it is a policy.
- Weigh the unit, not the model, wherever the consequence is large. That is small units on high-value crops first, per the table above — the opposite of where most people start.
- Make the wash cycle a re-tare opportunity. The unit is empty, it is being handled, and it has just had the thing that causes drift removed from it. That is the cheapest moment in the year to get a real number.
One last framing. Tare is the only container specification that is simultaneously a freight cost, an injury risk and an accounting input, which is why it gets owned by nobody. Give it to whoever signs the invoices — they are the one who pays for it being wrong.
Related reading: the capacity side is how much produce fits in a bulk bin, the freight side is bins per semi-trailer, the return-leg economics of folding units are in collapsible vs fixed bulk bins, and when a drifting unit has stopped being serviceable at all, the criteria are in inspection and retirement. Browse the range in bulk containers and plastic crates, or by sector at fresh produce and mining, and the whole range in the catalogue. When you are ready, send your crop density, the footprint you run and whether the units go over a trade scale for a spec-backed quote.
Common questions
What is the tare weight of a bulk bin or crate?
Tare is the mass of the empty container, subtracted from the gross weighed mass to get the net weight of the goods. Across our own range it runs from 0.62 kg for a 13 L crate to 95 kg for a 1,000 L folding bulk container. The more useful figure is tare as a share of gross: at a planning density of 600 kg/m³ that runs 4.75% to 13.67% across the 67 containers in our range that publish both a tare and a volume. Note that a published tare is a nominal, as-manufactured figure — it is not a measurement of the specific unit sitting on your scale after three seasons of work.
Do I have to subtract the bin weight when I sell produce by net weight?
For pre-packaged goods the National Measurement Institute is explicit that you must “only display the net weight of the fruit or vegetables (do not include the weight of any packaging)”, and that you must allow for moisture loss so the pack is accurate at the time of sale (industry.gov.au). Sale by measurement in Australia is regulated under the National Measurement Act 1960 and the National Trade Measurement Regulations 2009, and NMI publishes that short-measuring customers can attract a fine of up to $222,000 per offence. Exactly which duties attach to your particular arrangement — farm gate, wholesale, weighbridge, contract packing — is a question for NMI, not for a container supplier. What we can tell you is the physical half: the tare you subtract has to be the tare of the container you actually weighed.
Is a lighter bin always better?
No, and our own catalogue is the clearest evidence. Take the 1200 × 1200 footprint. BPB-V121210-18 is 32 kg for 1,070 L, a tare share of 4.75%, and publishes 1,400 kg static. BPB-C1212S80 is 52 kg for 880 L, a tare share of 8.97%, and publishes 7,000 kg static. The light one is 1.89× better on tare share and carries a published static rating 5.0× lower. Lighter is better for freight and for the invoice; heavier is what survives being stacked, racked and hit by a forklift. Pick from the load case first — the three ratings are explained in plastic pallet load ratings — then optimise tare inside what is left.
How often should I re-weigh (re-tare) bins and crates?
There is no published interval we can point you to, and we will not invent one. What the physics says is that drift accumulates with soil contact, wash cycles skipped, repairs and added components — so tie re-taring to those events rather than to the calendar alone. A workable pattern: re-weigh a random sample of the fleet at the start of each season, re-weigh any unit after a repair or component change, and re-weigh whenever a unit comes back from a job that put it in mud. If a single fleet-wide tare is used for invoicing, the number that matters is not the average of the fleet but the spread — the error on any one invoice is set by how far that unit sits from the assumed figure.
Does a repaired or second-hand container have a different tare?
Yes, and this is the case people miss. Published tare describes the unit as manufactured. Replace a base, add a runner, fit a lid or a liner, and the mass changes with nothing on the container to say so. Second-hand stock is the same problem with more history behind it — which is one more reason to weigh rather than assume; the general checklist is in second-hand vs new bulk bins. The safe rule: if the unit has been altered in any way, its catalogue tare no longer describes it.
How were the figures on this page calculated?
From published catalogue data and one stated assumption. Tare and volume are the published figures for each SKU. Payload is volume × 600 kg/m³, a planning density we state rather than a property of any crop — use your own density and the arithmetic still works. Tare share is tare ÷ (tare + payload). Drift sensitivity is simply drift ÷ payload, expressed as a percentage. We checked that every row's assumed payload sits within that model's published dynamic rating, and it does, though the light-duty bins sit close to theirs. The regulatory figures — the net-weight requirement and the $222,000 maximum penalty per offence — are quoted from the National Measurement Institute. No pricing of any kind appears on this page and none is implied by any ratio on it.
Sources: net-weight and packaging requirements for produce sold by measurement, scale approval and verification duties, and the maximum penalty of $222,000 per offence for short measure, National Measurement Institute (Department of Industry, Science and Resources), Selling fruit and vegetables, industry.gov.au; the governing instruments are the National Measurement Act 1960 and the National Trade Measurement Regulations 2009. That guidance addresses the retail and wholesale sale of fruit and vegetables and pre-packaged goods; it is quoted here to establish that net excludes packaging and that short measure is the seller’s offence, and it is not advice on any particular commercial arrangement — direct those questions to NMI. Tare, volume, external dimensions and load ratings are the published figures for each model in our own catalogue on the date of writing and change as the range changes; the counts (67 containers publishing both tare and volume, 36 bulk containers and 31 crates) are a direct count of that catalogue. Payload, tare share and drift sensitivity are computed from those published figures at a stated planning density of 600 kg/m³, which is an assumption for illustration and not a property of any crop; substitute your own density. Published tare is a nominal as-manufactured figure, not a measurement of any individual unit. No water-absorption figure is quoted for any polymer because none was verified for this page. Load figures are manufacturer-tested ratings for the specific models shown and vary with load distribution and beam span. Not a quote.